Category Archives: How to use cycle app

Collection of blogs on how to use cycle app effectively and make good investment decisions

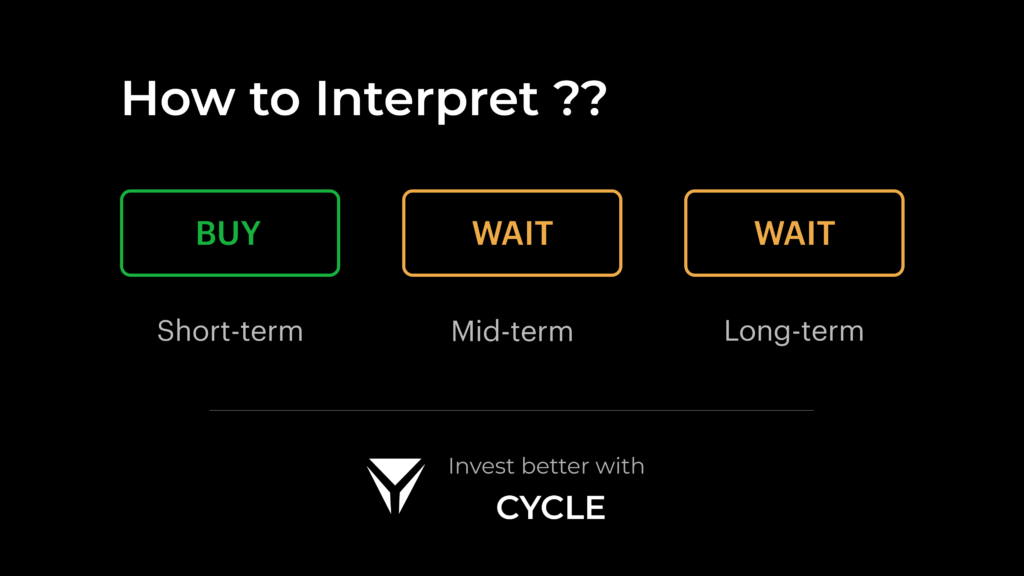
Buy – Wait – Wait | What does this signal combination mean?

Swing Trader’s Guide to Buy Wait Wait Signal

The Buy Wait Wait Signal indicates an opportunity to book profit and exit the current holdings.

You should keep a track of when the Wait signal changes to identify the correct opportunity to enter when the Wait turns to Buy signal again.

Short-Term Trader’s Guide to Buy Wait Wait Signal

For Short Term Investors, the Buy Wait Wait signal indicates an opportunity to book profit and exit the current holdings.

You should keep a track of when the Wait signal changes to identify the correct opportunity to enter when the Wait turns to Buy signal again.

Long-Term Trader’s Guide to Buy Wait Wait Signal

For Long Term Investors, the Buy Wait Wait signal indicates a no fit for the long term as there is no indication of a positive move from the stock

To make this decision even more bullish – Look for stocks with a CRS score of 80+ which indicates that the particular stock is in the top 20% performers in the last year with respect to price performance.

Always remember to put a stop-loss in the order as nobody can be 100% sure about the signals that they provide and it’s always better to be safe rather than sorry later. Cycle app suggests stop-loss for each time-frame

Buy – Wait – Buy | What does this signal combination mean?

Swing Trader’s Guide to Buy Wait Buy Signal

The Buy Wait BuySignal indicates an opportunity to book profit and exit the current holdings.

You should keep a track of when the Wait signal changes to identify the correct opportunity to enter when the Wait turns to Buy signal again.

Short-Term Trader’s Guide to Buy Buy SellSignal

For Short Term Investors, the Buy Buy Sell signal indicates a strong buy momentum in the short term. Indicating that you can enter this stock as it is in a fully bullish mode in the near term as of now. But be aware of reversals.

You should sell and book profit when the short term or medium term signal turns to Wait.

Long-Term Trader’s Guide to Buy Buy Sell Signal

For Long Term Investors, the Buy Buy Sell signal indicates a no fit for the long term as there is no indication of a positive move from the stock

To make this decision even more bullish – Look for stocks with a CRS score of 80+ which indicates that the particular stock is in the top 20% performers in the last year with respect to price performance.

Always remember to put a stop-loss in the order as nobody can be 100% sure about the signals that they provide and it’s always better to be safe rather than sorry later. Cycle app suggests stop-loss for each time-frame

Buy – Buy – Sell | What does this signal combination mean?

Swing Trader’s Guide to Buy Buy Sell Signal

The Buy Buy Sell Signal indicates a strong buy momentum in the short term. Indicating that you can enter this stock as it is in a fully bullish mode in the near term as of now. But be aware of reversals.

You should sell and book profit when the short term signal turns to Wait.

Short-Term Trader’s Guide to Buy Buy SellSignal

For Short Term Investors, the Buy Buy Sell signal indicates a strong buy momentum in the short term. Indicating that you can enter this stock as it is in a fully bullish mode in the near term as of now. But be aware of reversals.

You should sell and book profit when the short term or medium term signal turns to Wait.

Long-Term Trader’s Guide to Buy Buy Sell Signal

For Long Term Investors, the Buy Buy Sell signal indicates a no fit for the long term as there is no indication of a positive move from the stock

To make this decision even more bullish – Look for stocks with a CRS score of 80+ which indicates that the particular stock is in the top 20% performers in the last year with respect to price performance.

Always remember to put a stop-loss in the order as nobody can be 100% sure about the signals that they provide and it’s always better to be safe rather than sorry later. Cycle app suggests stop-loss for each time-frame

Buy – Buy – Wait | What does this signal combination mean?

Swing Trader’s Guide to Buy Buy Wait Signal

The Buy Buy Wait Signal indicates a strong buy momentum in the short term. Indicating that you can enter this stock as it is in a fully bullish mode in the near term as of now. But be aware of reversals.

You should sell and book profit when the short term signal turns to Wait.

Short-Term Trader’s Guide to Buy Buy Wait Signal

For Short Term Investors, the Buy Buy Wait signal indicates a strong buy momentum in the short term. Indicating that you can enter this stock as it is in a fully bullish mode in the near term as of now. But be aware of reversals.

You should sell and book profit when the short term or medium term signal turns to Wait.

Long-Term Trader’s Guide to Buy Buy Wait Signal

For Long Term Investors, the Buy Buy Wait signal indicates a possible reversal and presents an opportunity to book profit.

You should sell when the long-term signal turns to wait and book profit. If you do not hold the stock in your portfolio then please wait for the signal to either turn into a BUY or a SELL signal before taking any form of action.

To make this decision even more bullish – Look for stocks with a CRS score of 80+ which indicates that the particular stock is in the top 20% performers in the last year with respect to price performance.

Always remember to put a stop-loss in the order as nobody can be 100% sure about the signals that they provide and it’s always better to be safe rather than sorry later. Cycle app suggests stop-loss for each time-frame

Buy – Buy – Buy | What does this signal combination mean?

Swing Trader’s Guide to Triple Buy Signal

The Triple Buy Signal on all time-frames indicates a strong buy momentum. Indicating that you can enter this stock as it is in fully bullish mode as of now.

You should sell and book profit when the short term signal turns to Wait.

Short-Term Trader’s Guide to Triple Buy Signal

For Short Term Investors, the Triple Buy Signal on all time-frames indicates a strong buy breakout. Indicating that you can enter this stock as it is in fully bullish mode as of now.

You should sell and book profit when the short term or medium term signal turns to Wait.

Long-Term Trader’s Guide to Triple Buy Signal

For Long Term Investors, the Triple Buy Signal on all time-frames indicates a strong buy breakout. Indicating that you can enter this stock as it is in fully bullish mode as of now.

You should sell when the midterm or Long term signal turns to Wait.

To make this decision even more bullish – Look for stocks with a CRS score of 80+ which indicates that the particular stock is in the top 20% performers in the last year with respect to price performance.

Always remember to put a stop-loss in the order as nobody can be 100% sure about the signals that they provide and it’s always better to be safe rather than sorry later. Cycle app suggests stop-loss for each time-frame

How to make the right investments | Proven Demand & supply approach

Making the right investment decisions can be complicated. We may read the news and find immense data on a stock that is doing pretty well in the market, and conclusively, everyone starts to talk about that stock, a few buy it, and on very rare occurrences, they end up earning great results.

But have you ever wondered the deep-rooted reason this happens? or understood the science behind how that stock is doing so well at that moment? How is its price on the rise? We have a straightforward answer to that; it is because of the Demand & Supply principle. 

Before we dive deeper into how we can use the law of demand and supply to make the right investment decisions, let us first understand the law of demand and supply.

Law of Demand and Supply 

The law of demand and supply is a universal concept where the price is a function of demand and supply. It is an economic model that determines the value in a market. It assumes that in a competitive market, holding all else equal, the unit price for a particular good, or other traded item such as labour or liquid financial assets, will vary until it settles at a point where the quantity demanded (at the current price) will equal the amount supplied (at the current price). 

In simpler words, demand and supply will keep pulling and pushing prices in either way depending on their value in its market. 

How do you make the right investment decision using the demand and supply approach?

There are a hundred reasons that could coherently affect the demand and supply of a particular company. Significant factors that could affect the demand and supply for stocks are economic data and corporate results. Great economists have tried and failed to predict, time and again, what could possibly be the central and foremost reason behind the fluctuation between the relation of demand and supply, and price and in retrospect can only be talked about and analyzed.

When the demand of a company rises and does not have supply to support it we should buy the stock. When the supply of a stock increases, without the demand to satisfy it, we should sell the stock. This could single-handedly take months of research before actually predicting the future of stock by an ordinary human being.

How do we simplify this process for you to make quick investment decisions?

  • Cycle app helps you translate the demand and supply approaches into actionable buy and sell signals through its swift algorithms; offering signals that could take months of research to reach an enforceable decision. 
  • When supply does not meet demand, it shifts to a buy signal and when demand doesn’t meet supply then shifts to sell, and when both demand and supply meet, it gives a wait signal helping you make better investments. 

To back this up, it gives a signal history of the performances of over 10000+ companies, and how using this approach has helped many make profits and save losses. 

Please refer to How to use Cycle tutorials for learning how to make effective use of demand and supply principles with the help of various signal combinations in short term & long term investing.
How does the stock-details section help you make better investment decisions?

Unlike any other investment platform, “Cycle” users too, have the access to verifiable and user-friendly historical data for all the stocks.

Rather than cluttering the minds of investors by providing a wealth of incomprehensible financial raw data. Our app smartly presents stock information in a manner easy to use yet comprehensive, versatile (non-static) and relevant to every class of investors. 

For every stock, the user can access its details by clicking on respective signals mentioned under relevant time frames (i.e. short, medium and long term). The following page will have information presented under 2 broad categories:

Key Statistics

This provides actionable insights for a given scrip by virtue of its:

Returns: Return On Investments given by the stock in a particular period depending on the timeframe

Ranking: How has the stock performed in that timeframe with respect to all other stocks

Comparative performance: In percentage is the stock in the top performers or the bottom performers.

Cycle Signal Performance History

Provides a detailed view of the historical price movement alongside the result of signals which cycle had given at the time.

Before choosing an investment strategy based upon various signal combinations we strongly recommend Cycle users leverage the information available on this page for maximising their gains. 

What does the “time-lines” signify in the cycle app?

Find out how the timelines can help you identify best investments according to your risk and commitment appetite

What is a Time frame

Time frame refers to the amount of time that a trend lasts for in a market, which can be identified and used by traders. It is generally associated with the duration of the investment.

Time frame in Cycle

To facilitate trading decisions, “Cycle” takes into account the three-time frames namely, Short term, Mid-term & Long term and uses it in various following contexts: 

ContextShort TermMid Term Long Term
Trading frequencyWeekly-MonthlyMonthly-YearlyYearly
Price range move100%100-500%500-1000%
Stop-Loss25-30%30-40%50%
Risk ProfileHighAverageLow
Investment Duration< 1 year1 year-3 year2 years-10 years
ReversalPrevious DayPrevious WeekPrevious Month

Trading under various time frames

“Cycle” conveys signals for every stock against all three respective time frames i.e. short term, mid term & long term. The signals will essentially be BUY, SELL or WAIT

Using “Suggestions” effectively to make better stock market decisions

Utility of “Suggestions” section in Cycle app

“Suggestions” in “Cycle” is a premium section of the app with members-only access and is a paid subscription.

It has a curated list of stocks for the users to take advantage of, in trading by maximising profits and minimising losses by sorting and separating the best stocks and worst stocks in different sections

What to expect in “Suggestions” 

Under this section you see the following lists:

  • BUY: Stocks which are in a Breakout zone with BUY signals in all 3 time frames i.e. Short, mid & long term. 
  • SELL: Stocks which are in a Breakdown zone with SELL signals in all 3 time frames i.e. Short, mid & long term.
  • Reversal: Stocks that have just entered either the BUY or SELL zone. One can see the list under various time frames. If the reversal happened the previous day (it is under short term), if the previous week (it is under Mid term) and if the previous month (it is under long term).
    For the benefit of users the list is visible under two distinct reversal sub-categories i.e. “Sell-to-Buy” and “Buy-to-Sell”.

Identify opportunities to enter and exit using “Reversals”

What is a Reversal?

For any stock, if there’s a change in direction of its price trend, from going up to going down or vice-versa, it is termed as ‘Reversal”. It helps an investor to determine the time for entry or exit in a trade. 

How to identify a Reversal in “Cycle”

Cycle helps its users to identify a Reversal at two stages:

  1. Indication of possible reversal: For a given stock, the app will give a “WAIT” signal under respective time frame (i.e. short, medium or long term) indicating a possible reversal in near future. 
  1. Confirmation of reversal: Users can access “Reversal list” under the “Suggestions” area within the app which is for subscribers only access. This section gives a curated list of stocks under various time frames for both type of reversals:
    • “BUY” to “SELL”: implying an exit
    • “SELL” to “BUY”: possible entry point