“Suggestions” in “Cycle” is a premium section of the app with members-only access and is a paid subscription.
It has a curated list of stocks for the users to take advantage of, in trading by maximising profits and minimising losses by sorting and separating the best stocks and worst stocks in different sections
What to expect in “Suggestions”
Under this section you see the following lists:
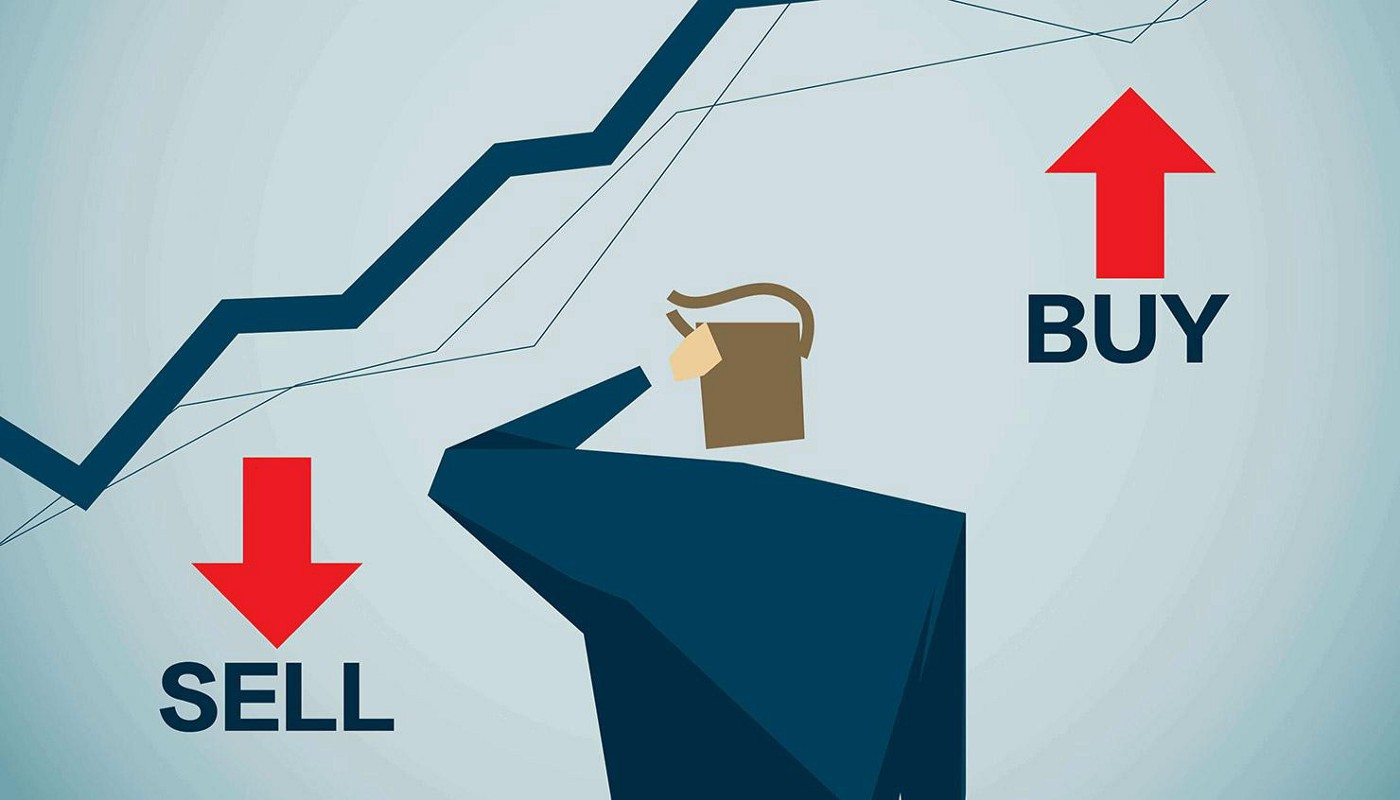
BUY: Stocks which are in a Breakout zone with BUY signals in all 3 time frames i.e. Short, mid & long term.
SELL: Stocks which are in a Breakdown zone with SELL signals in all 3 time frames i.e. Short, mid & long term.
Reversal: Stocks that have just entered either the BUY or SELL zone. One can see the list under various time frames. If the reversal happened the previous day (it is under short term), if the previous week (it is under Mid term) and if the previous month (it is under long term). For the benefit of users the list is visible under two distinct reversal sub-categories i.e. “Sell-to-Buy” and “Buy-to-Sell”.
For any stock, if there’s a change in direction of its price trend, from going up to going down or vice-versa, it is termed as ‘Reversal”. It helps an investor to determine the time for entry or exit in a trade.
How to identify a Reversal in “Cycle”
Cycle helps its users to identify a Reversal at two stages:
Indication of possible reversal: For a given stock, the app will give a “WAIT” signal under respective time frame (i.e. short, medium or long term) indicating a possible reversal in near future.
Confirmation of reversal: Users can access “Reversal list” under the “Suggestions” area within the app which is for subscribers only access. This section gives a curated list of stocks under various time frames for both type of reversals:
‘Stop-Loss’ is an advance order designed to limit an investor’s loss in a particular stock. It is generally a price at which the ‘sale order’ gets triggered for a particular stock that is undergoing a downward trend, thereby, protecting the capital from further erosion.
The devaluation of stock may happen because of any reason but the basic idea is to protect your own capital as much as possible. To stay in the market and continue investing. It is a highly recommended risk management technique.
Our app “Cycle” has been designed to advise you on the “Stop-Loss” aspect of risk management.
For every stock that has a BUY signal under any given time frame vis-a-vis Short, medium and long term. This can be used as it is by our users while booking their trades.
Please refer to How to use Cycle tutorials for learning how to make effective use of stop-loss with the help of various signal combinations in short term & long term investing.
The CRS Score is one of the unique points which make insights by the cycle app invaluable. It is being followed by Industry leaders across the US and India to make decisions in the stock market
Cycle Relative Strength (CRS) Rating indicates the price performance of a particular stock in comparison to all other stocks that get traded on a particular stock exchange. Quite simply put, it reflects whether a given stock is a leader, a mediocre performer or a laggard in the stock market.
Interpretation of CRS rating?
Generic interpretation
CRS Score
Interpretation
70>
Outperformer stock
40-69
Average / Mediocre performer
39<
Laggard
Range of CRS Score in Cycle app
Critical Interpretation
The CRS rating is given out of 100. If the CRS rating for a given stock is 82, it essentially means that the stock is beating 82% of other stocks based upon price performance over the last 4 quarters.
Please refer to How to use Cycle tutorials for learning how to make effective use of the CRS score with the help of various signal combinations in short term & long term investing.
For being a profitable Long Term trader you should first look at those stocks which have a “BUY” signal in the long term.
Trading is primarily driven by two strategies.
To buy at breakouts.
To buy after corrections.
Buying at breakouts
If the signal combination for both the Midterm and the Long term is showing “BUY”, it clearly reflects breakout and hence one can go ahead and buy the script.
Leveraging from corrections
Midterm Signal
Long term Signal
Interpretation
BUY
WAIT (when the signal has changed from SELL to WAIT)
Buy When Long term changes to BUY
BUY
WAIT(when the signal has changed from BUY to WAIT)
Book profit if bought in past
WAIT (when the signal has changed from SELL to WAIT)
BUY
Buy It’s a breakout when Mid-term changes to BUY
WAIT (when the signal has changed from BUY to WAIT)
BUY
Book profit if bought in past
Leveraging from corrections in the market through cycle app
Using Stop loss function
Once you have identified which Scrip to buy, you should next take care of your investment against any unforeseeable losses on account of market fluctuations.
Therefore, use the Long term “stop-loss” which has already been mentioned in the “Cycle” app.
Please refer to How to use Cycle tutorials for learning how to make better decisions for long term investments with the help of various signal combinations along with CRS score, stop loss and reversals
For being a profitable short term trader you should first look at those stocks which have a “BUY” signal in the midterm. This will increase the probability of gains.
Trading is primarily driven by two strategies.
To buy at breakouts.
To buy after corrections.
Buying at breakouts
If the signal combination for both short term and midterm is showing “BUY”, it clearly reflects breakout and hence one can go ahead and buy the script
Leveraging from corrections
Short term
Midterm
Interpretation
WAIT (when the signal has changed from SELL to WAIT)
BUY
buy: when short term changes to BUY
WAIT (when the signal has changed from BUY to WAIT)
BUY
Book profit if bought in past
Leveraging Corrections in cycle app
Using Stop loss function
Once you have identified which Script to buy, you should next take care of your investment against any unforeseeable losses on account of market fluctuations.
Therefore, use the short term “stop-loss” which has already been mentioned in the “Cycle” app.
Please refer to How to use Cycle tutorials for learning how to make better decisions for short term investments with the help of various signal combinations along with CRS score, stop loss and reversals
Stock markets across the globe operate as a function of price movement. And therefore the “Cycle” app is principally designed on the concept of “Demand & Supply”. If demand increases then the price of the stock will increase and if supply increases then the price will decrease. Therefore, for generating signals at any given point in time, “Cycle” takes into account the demand and supply situation according to daily data generated in stock exchanges.
Our Philosophy
The “Cycle” app works around the following philosophies:
Reactive Technical Analysis: It takes into account all available historical data for a script while analysing and generating signals.
Trend Following: It helps in riding the tide rather than speculating the odds.
Risk management: Helps the user to protect the capital in case of unfavourable circumstances.
Signal Generation
Based upon the given principle and our philosophies, “Cycle” generates one of the following signals for its users to act upon.
BUY
SELL
WAIT
These signals get generated under three-time frames namely:
Short-Term (less than one year)
Mid-Term (1 year to 3 years)
Long-Term (2 years to 10 years)
These signals are advised to be used in various combinations to attain different trading goals. Please refer to other “Cycle” tutorials to learn more in detail.
How much time and energy should I give to my investment management activity?
If we are in any job or business from which we earn our livelihood and save enough to invest in some assets for saving ourselves from inflation and building a nest egg for our families future, then I recommend that we must have a basic understanding of financial markets and select professional to handle our investment management activity, we must review the performance of professional appointed, but leave day to day work to him, if needed we can change the professional if we are not satisfied with the performance.
We don’t do our own surgery, we appoint well-qualified doctors for it, why?
Because doing surgery involves great painstaking study which we know we have not done and we can’t do.
Investing in stocks is easy, Right? Think again.
Doing investments in stocks from the surface doesn’t require much skill, you can open a brokerage account and buy any shares you have heard from your sources. You may face profit or loss in the short term with its kick of high or pain, both are harmful to you in the long term.
If you gain profits in your early trades, you become overconfident about the result, attribute it to your skills rather than market movements and you lose big in near future and quit the market for life.
If you lose in your early trades you quit the market for life,
Both outcomes are very bad for our future.
The best investment in our life is we
We must focus on our job and spend maximum possible time to upgrade ourselves in our vocation and enjoy free time with friends and family, pay a small fee to professional to manage your investment and save yourself from agony and loss of opportunity of markets, and save a lot of time, the return you will get on investment in yourself will far outperform your return from investment in time and energy you will spend to run your investments on day to day basis.
२८ मई, २०२१, स्टॉक मार्किट की दुनिया में एक ऐतिहासिक दिन था, जो हमें फिर से उस सवाल की तरफ ले जाता है की
एक इन्वेस्टर को अब क्या करना चाहिए?
सबसे पहले तो आइये, हम मिल कर स्टॉक मार्किट के इस यादगार पल को सेलिब्रेट करें।
हम आपको इसकी वजह बताएं, इसके पहले चलिए हम बात करते हैं की यह आपकी कैसे मदद कर सकता है और आपको इससे क्या फायदा हो सकता है।
नयी ऊंचाई को खरीदना चाहिए, बेचना नही।
– माइकल बैटनिक
हम इस बात में विश्वास रखते है। आइये इसका मतलब समझते है।
निफ़्टी करीब करीब २० साल से लगातार ऊंचाई पे चढ़ता गया है।
विश्वास नहीं हो रहा? आप खुद देख लीजिए।
नीचे दी गयी चार्ट में निफ़्टी के २००० से २०१० तक के prices है। ग्रीन डॉट्स मतलब आल टाइम हाई, और ग्रीन लाइन मतलब काफी समय तक आल टाइम हाई।
निफ़्टी पिछले १५ सालों से लगातार १२.५% का CAGR देता आया है (२००७-०८ वाले क्रैश को नज़र में रखते हुए)। यह कोई छोटी बात नहीं है। इन् सालों में निफ़्टी ने १०० बार से ज़्यादा आल टाइम हाई दिया है।
यह जो डेटा है, इस से यही साबित होता है की मार्किट में जब prices बढ़ जाते हैं, तभी बेचना नहीं, बल्कि खरीदना एक बेहतर ऑप्शन होता है। फिर भी अगर आप स्टॉक्स को ज़्यादा कीमत पर नहीं खरीदते हैं, तो उसमे कोई उदास होने वाली बात नहीं है अगर आपके पास काफी समय है और आपका पोर्टफोलियो बैलेंस्ड है जिससे आपको ज़्यादा नुक्सान नहीं होगा।
वारेन बफे लगभग ८० सालों से इन्वेस्ट करते आये हैं और उन्होंने हज़ार से भी ज़्यादा बार मार्किट में बरकत देखी है। जल्द से जल्द सही स्टॉक्स खरीदना उनका पहला हुनर थ। कौनसे स्टॉक में कितने पैसे इन्वेस्ट करने हैं, यह उनका दूसरा हुनर था। मगर उनका तीसरा और सबसे बड़ा हुनर यह था की वह मार्किट गिरने का शिकार नहीं बनते थे, और मार्किट के ऊपर उठने का इंतज़ार करते थे। उनका यह मानना था की भविष्य हमेशा अच्छा होगा, और उनकी यही सोच आज भी बरकरार है।
सारी बातों को ध्यान में रखते हुए
अगर निफ़्टी ऐसे ही हर साल १२.५% बढ़ता गया तोह क्या होगा, यह सोचा है? खैर, थोड़ा ज़्यादा हो गया यह।
चलो, हम एक अलग तरह से इसे देखते हैं।
यहां से आगे, अगर निफ़्टी से हमें 4००% रिटर्न चाहिए तो CAGR को किस रेट से बढ़ना होगा? निफ़्टी अगले १५ सालों तक अगर १०% CAGR के हिसाब से भी हर साल बढ़ता है, तो हम वहाँ पहुंच जाएंगे। ७५००० रुपयों तक, जो उस समय में आल टाइम हाई हो जाएगा। 😉
यह पुरे समय में हम कितने उतार चढ़ाव देखेंगे यह भी कोई नहीं कह सकता। कामयाबी का रास्ता हमेशा उतार चढ़ाव से भरा हुआ रहता है, मगर आपको हमेशा यह एक बात याद रखनी होगी: लम्बे समय में मार्किट की कीमत बढ़ने ही वाली है, मार्किट ऐसे ही काम करते आया है।
आप इस बारे में क्या सोचते हैं यह हमें कमैंट्स में बताइये। अगर आपको लगता है की यह पढ़ने से आपके किसी अपने की मदत हो सकती है, तो दिल खोल के उनके साथ यह शेयर कीजिये।
धन प्रबंधन कार्यक्रम के बारे में अधिक जानने के लिए — हमें एक ईमेल भेजें admin@iamclearmind.com
निवेश करते समय निवेश और निर्णय लेने से संबंधित ऐसी और गहरी और व्यावहारिक सामग्री के लिए, हमें फॉलो करें — Instagram and Twitter.
हमने शेयर बाजार की अपनी सारी सीख डाल दी है और उन्हें सिस्टम में बदल दिया है। जो हमें कई समय-सीमाओं पर खरीदने और बेचने के संकेत देता है, जो रुचि रखने वालों के लिए मुफ्त में उपलब्ध है, प्ले स्टोर पर — DOWNLOAD the CYCLE app , आईओएस उपयोगकर्ताओं के लिए, क्रपया पधारें mycycles.in (ऐप स्टोर जल्द ही आ रहा है)
भारत में कैश पैमेंट करने का एक लोकप्रिय साधन है। इंटरनेट और फिनटेक में आयी तरक़्क़ी ने भले ही लोगों को डिजिटल पैमेंट की तरफ धकेला हो, लेकिन आज भी ज्यादातर लोग कैश से ही सारी पैमेंट करना पसंद करते हैं। और यह कैश हमारी अर्थव्यवस्था (इकॉनमी) में भी एक महत्वपूर्ण भूमिका निभाता है।
हमें कभी-कभी ऐसे अवसर मिलते हैं, जहाँ हम अपने पैमेंट कैश में लेकर टैक्स बचा सकते हैं। लेकिन इस प्रक्रिया में हम ऐसा क्या बचाते हैं?
आपकी आमदनी या पैमेंट का 30% — अगर आप टॉप टैक्स ब्रैकेट में हैं।
आपकी आमदनी या पैमेंट का 10–20% — अगर आप लौ टैक्स ब्रैकेट में हैं।
मान लीजिये, आप अपनी पैमेंट टैक्स बचाने के लिए कैश में लेने लगे, तो दूसरा सबसे बड़ा सवाल यह है कि आप यह कैश रखेंगे कहाँ?
कैश निवेश करने के तीन बहुत ही लोकप्रिय साधन हैं –
सोना
रियल एस्टेट
या पैसे खर्च कर देना
अगर हम उस कैश को खर्च कर दें, तो बिना कोई सही इस्तेमाल हुई उसका 100% मूल्य चला जाता है।
और अगर हम गोल्ड या रियल एस्टेट खरीदें, तो उसको सुरक्षित रखना भी एक अलग ज़िम्मेदारी है। आम तौर पर पहले बताई हुई यह दोनों इन्वेस्टमेंट, आपको सालाना 10% रिटर्न देती हैं।
क्या होगा अगर हम 30% टैक्स का भुगतान करें और शेयर बाजार में 70% इन्वेस्ट कर दें?
आपको सालाना 20% का औसत रिटर्न मिलेगा और अगर आपने हमारी एडवाइजरी सर्विसेज का फायदा उठाया तो हम इसको कम्पाउंडिंग की मदद से 30 % में बदल सकते हैं। अंत में जिसका फायदा आपको ही होगा।
तो कैश में 10% और इक्विटी में 20/30% ऐसी कौनसी बड़ी बात है ?
यदि आप ऊपर दिए गए चार्ट को देखें, तो आपको पता चलेगा कि गोल्ड और रियल एस्टेट 100 रुपए के शुरुआती इन्वेस्टमेंट से केवल 10% ही कंपाउंड हुए। बीस साल के बाद, यह 100 रुपए बढ़कर 612 रुपए हो गए।
वहीं दूसरी ओर, हमने 70 रुपए का इन्वेस्टमेंट शेयर मार्केट में किया 30% टैक्स देने के बाद। बीस साल बाद जब हमने कैलकुलेट किया तो 20% रिटर्न के साथ वही पैसे बढ़कर 2236 रुपए बन गए थे। अगर सोचा जाए तो वही इन्वेस्टमेंट 30% रिटर्न देने पर 10233 रुपए बन जाएंगे।
यहां तक कि गोल्ड और रियल एस्टेट में 30% के हेडस्टार्ट के बाद भी उनके रिटर्न लम्बे समय में काफी पीछे छूट जाते हैं।
आपके लिए एक बोनस
शेयर बाजार से होने वाले मुनाफा में शॉर्ट टर्म कैपिटल गेन पर 50% टैक्स की छूट भी होती है। यहाँ एक साल के भीतर होने वाले मुनाफे की बात हो रही है। इस पर 30% टैक्स लगने के बजाये 15% टैक्स लगता है।
लॉन्ग टर्म कैपिटल गेन (1 साल से अधिक समय से लाभ) पर 70% टैक्स की छूट मिलती है, जिस पर 30% के बजाये 10% टैक्स लगता है।
कमेंट करके अपनी राय हम से शेयर करें और अगर आपको यह आर्टिकल पसंद आया तो आपने परिजनों से शेयर करना ना भूलें।